Maximise Revenue. Increase Control.

The revenue management platform built for BTR, shaped by industry

Mobile app navigation menu with icons for home, grid menu, growth chart, list, document, buildings, checkmark, heart, question mark, and settings.
Orange square with a white leaf symbol in the center
A black oval shaped search bar with a magnifying glass icon on the left and the placeholder text "Search for anything here..." in the center.
Calendar date range from August 25 to December 25 displayed on a smartphone screen.
Screenshot of a data analysis dashboard showing an overview of units, lease status, occupancy, vacancy, and upcoming items with numerical details.
Map of London with various neighborhoods and a red line route connecting Camden Town, Finsbury Park, Hackney, Stratford, and other areas.
A table showing financial data with columns labeled Guide Price, 12M Prior, Current Contract, Market Average, and Market Median. The rows contain monetary amounts in GBP, some in green and some in red.
Line graph titled 'Move In/Out' showing data from August to December, with two lines representing 'Move In' and 'Move Out' counts; October 25th data point highlighted with values 28 and 26 respectively.
Screenshot of a map with a popup menu labeled 'Compare Property' on a black background.
Black screen with a white button in the center that reads 'Draw Custom Area' and includes a small icon of a square with anchor points.
User interface element with a dropdown menu labeled 'Sector' and a downward arrow icon.
A black icon of a leaf on a dark background.

A smarter way to manage pricing

Abstract digital artwork with warm orange and yellow tones, featuring pixelated and wavy patterns.

01

A digital illustration of a data analytics or financial concept featuring a bar chart, a dotted line graph, a stack of coins, and a chart with currency symbols, all in a minimalist style with orange and light pink colors.

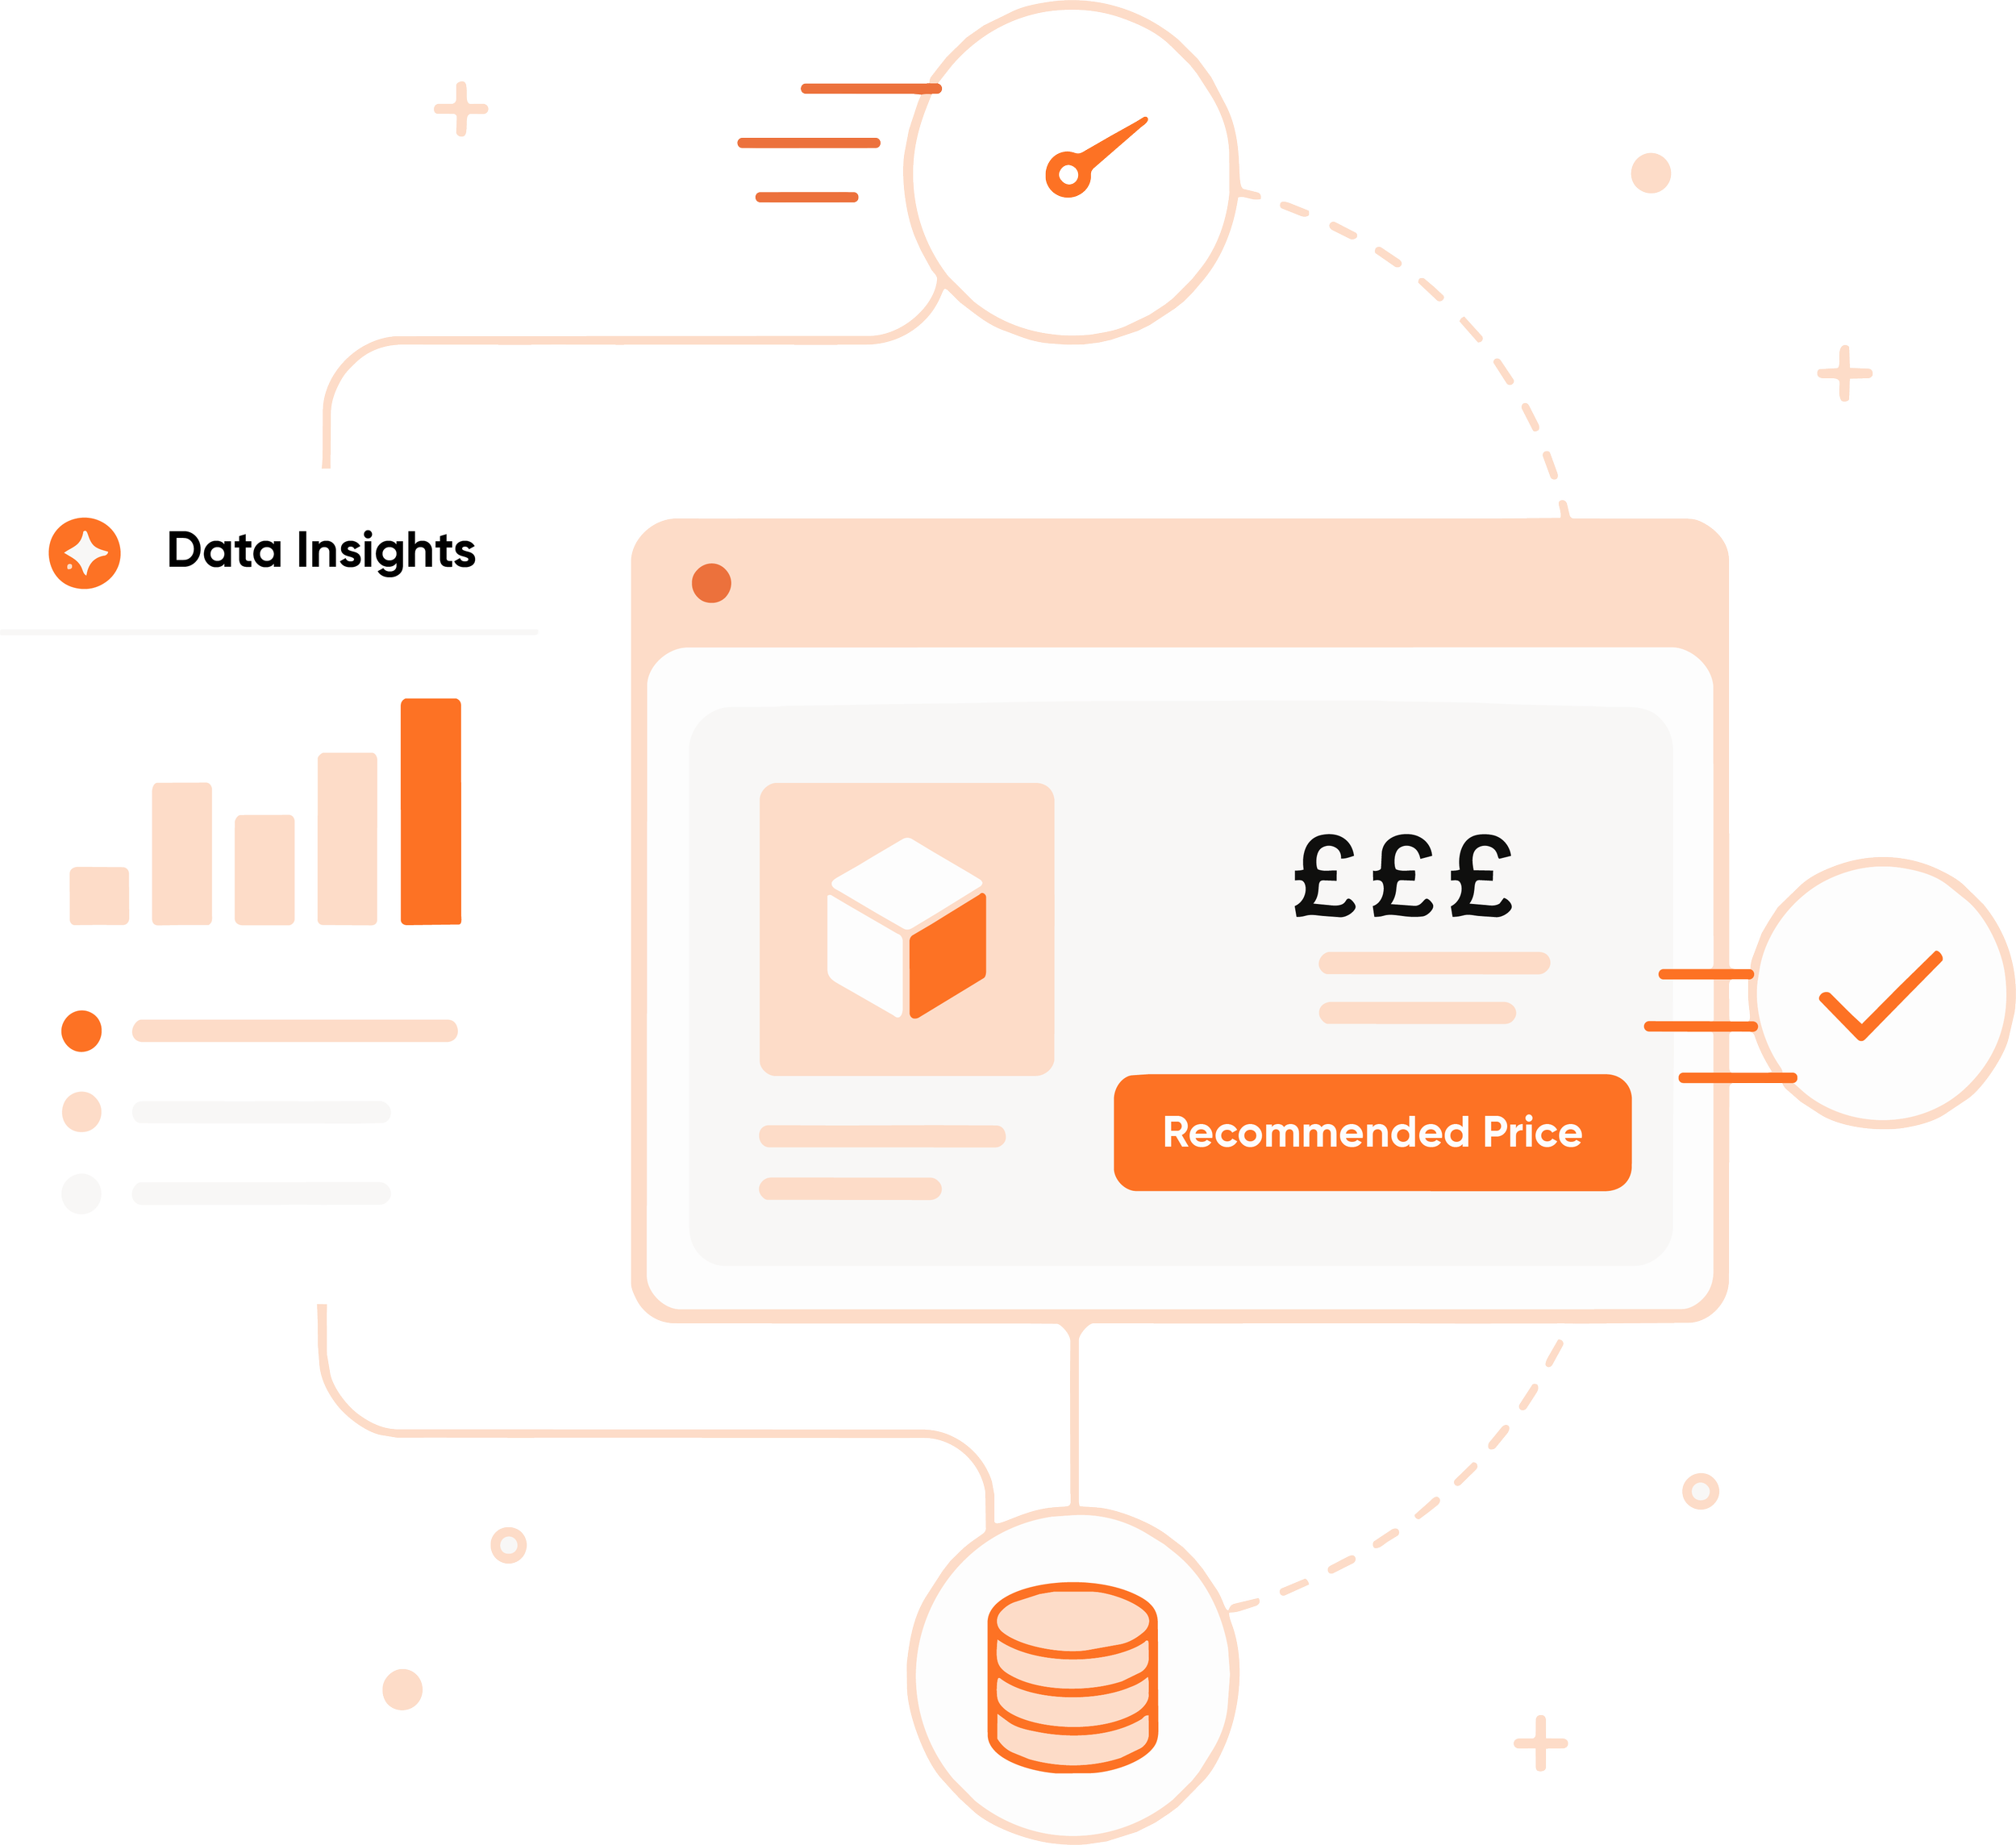
Optimised pricing for every home

Optimise pricing for every unit using real-time data and demand signals - maximising revenue while adapting to changing conditions.

Close-up of orange fabric with subtle shading and texture.

02

A digital infographic features a stylized gauge with an arrow pointing to the right, indicating high speed, accompanied by upward and rightward orange arrows. There is a bar graph with bars of varying heights, labeled 'Data Insights.' A box with six orange coins stacked vertically is also present, alongside an orange button labeled 'Recommended Price.' The illustration uses a modern, minimalistic design with a color palette of light cream, orange, and black.

Intelligent insights, instantly accessible

Turn complex data into clear, actionable insight with intuitive dashboards and our AI Assistant - so you can understand performance and act with confidence.

Abstract orange and peach-colored swirl pattern with pixelated sections.

03

Graphic depicting data insights, including a bar chart, a cube, currency symbols, and a stack of coins, with orange and light peach accents.

Price with real market context

Benchmark your pricing against locally achieved rents using our market insights feature, supporting every pricing and rent review decision with clear, defensible data.

Close-up of an orange wooden surface with light reflections.

04

Infographic with graphs, a gauge, a box, and a stack of coins, illustrating data insights and recommended prices.

Increase control and governance

Apply consistent pricing strategies across your portfolio with full visibility - ensuring every decision is controlled, trackable, and accountable.

Everything you need in one platform

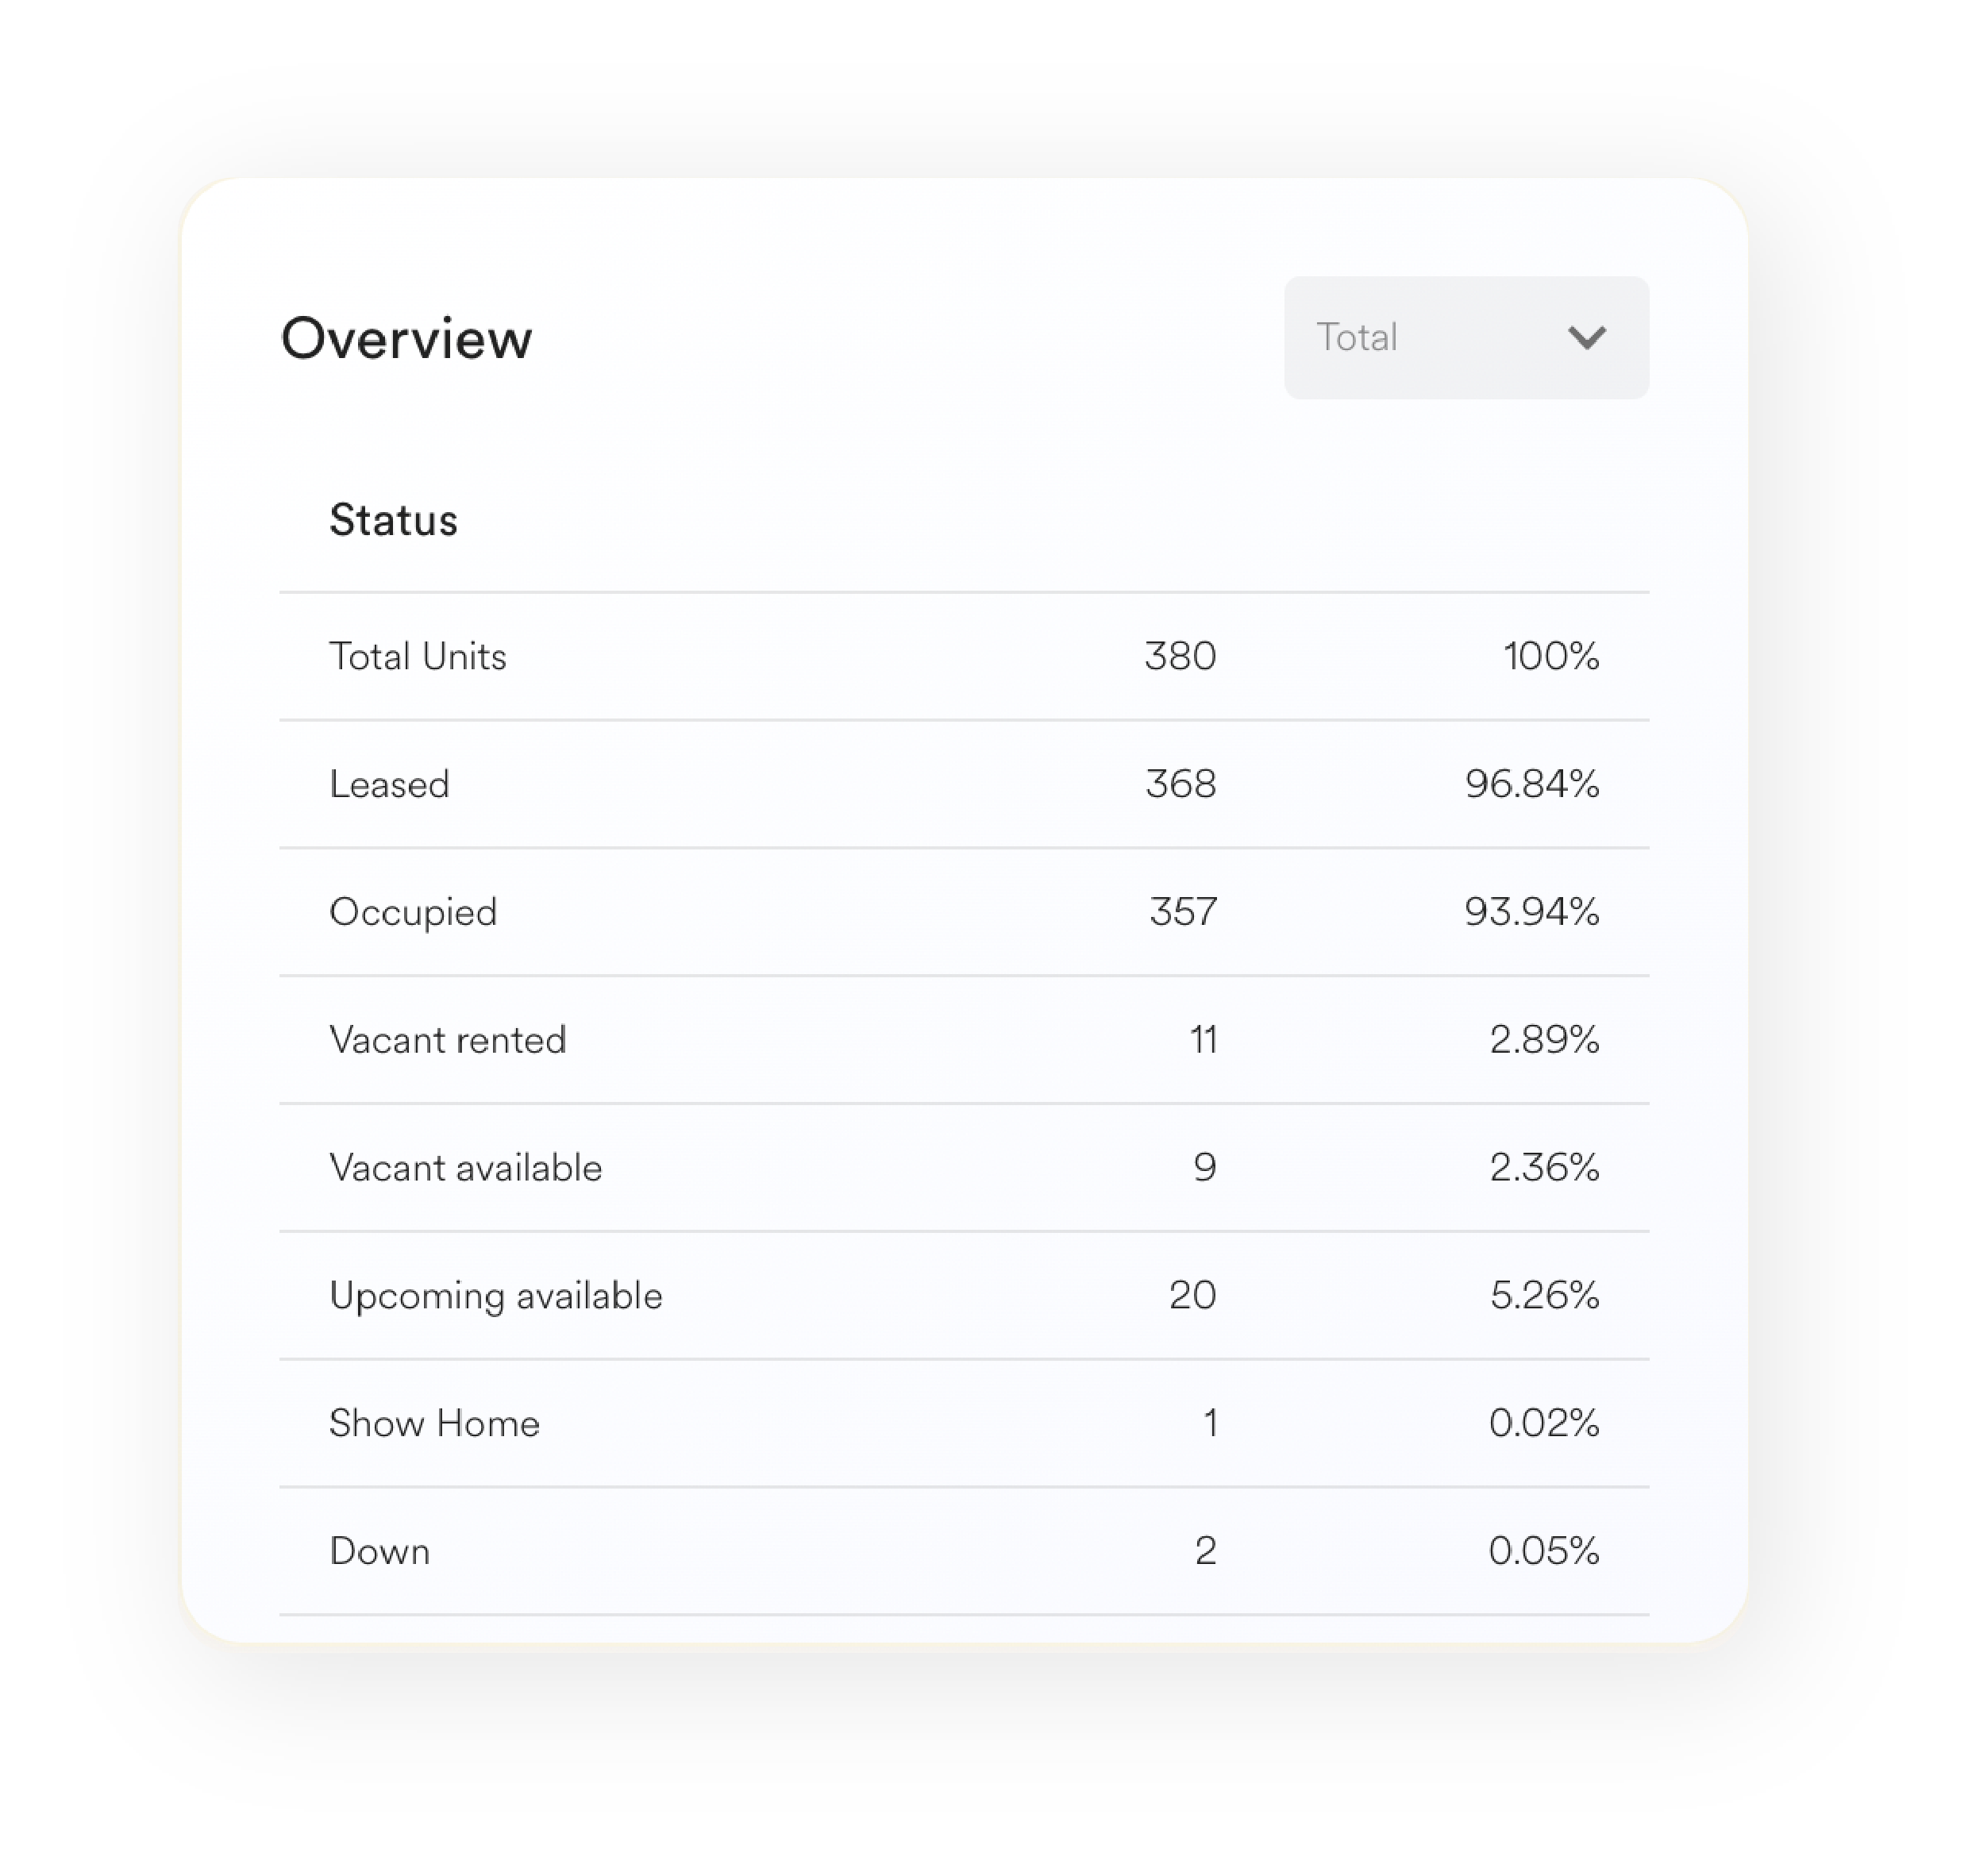
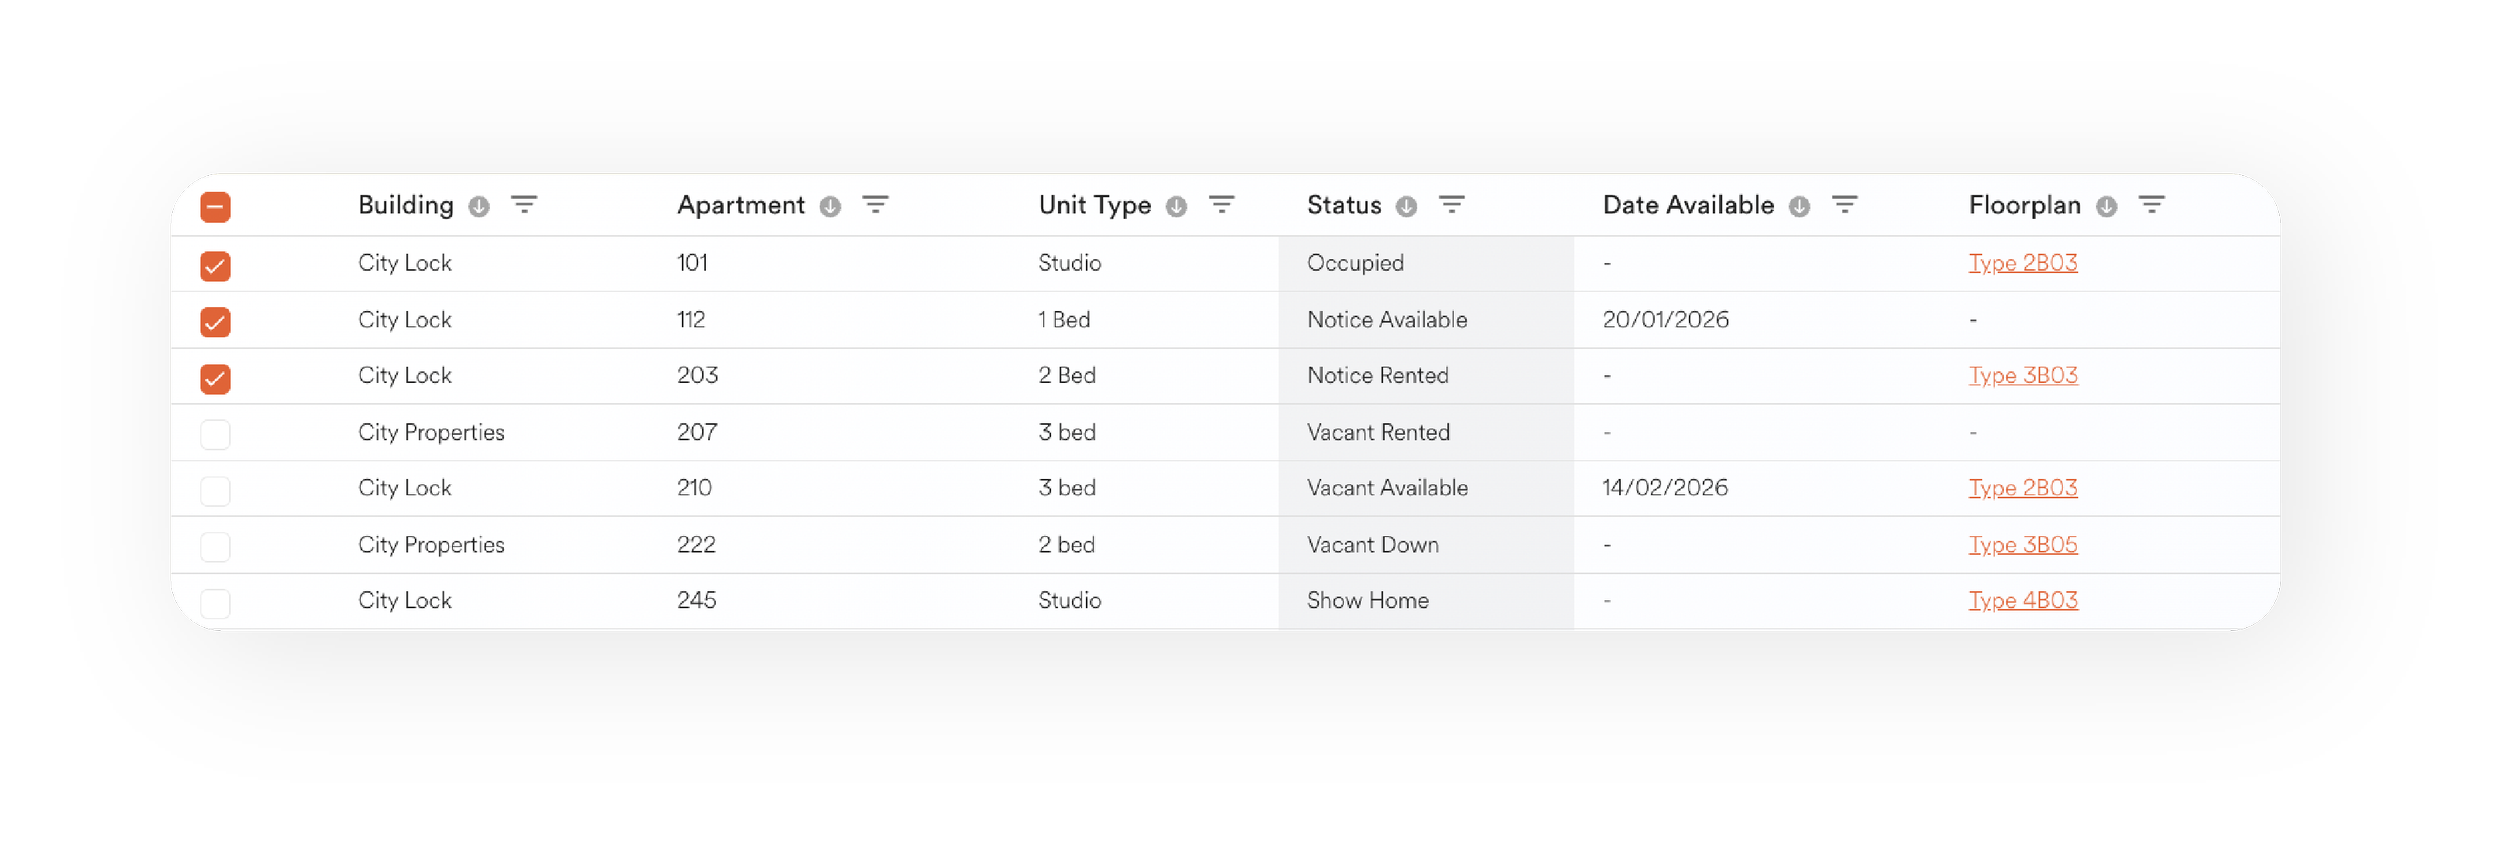
Availability & Pricing

View every unit’s status, attributes, and pricing in one place, with clear comparisons to previous lets and the market.
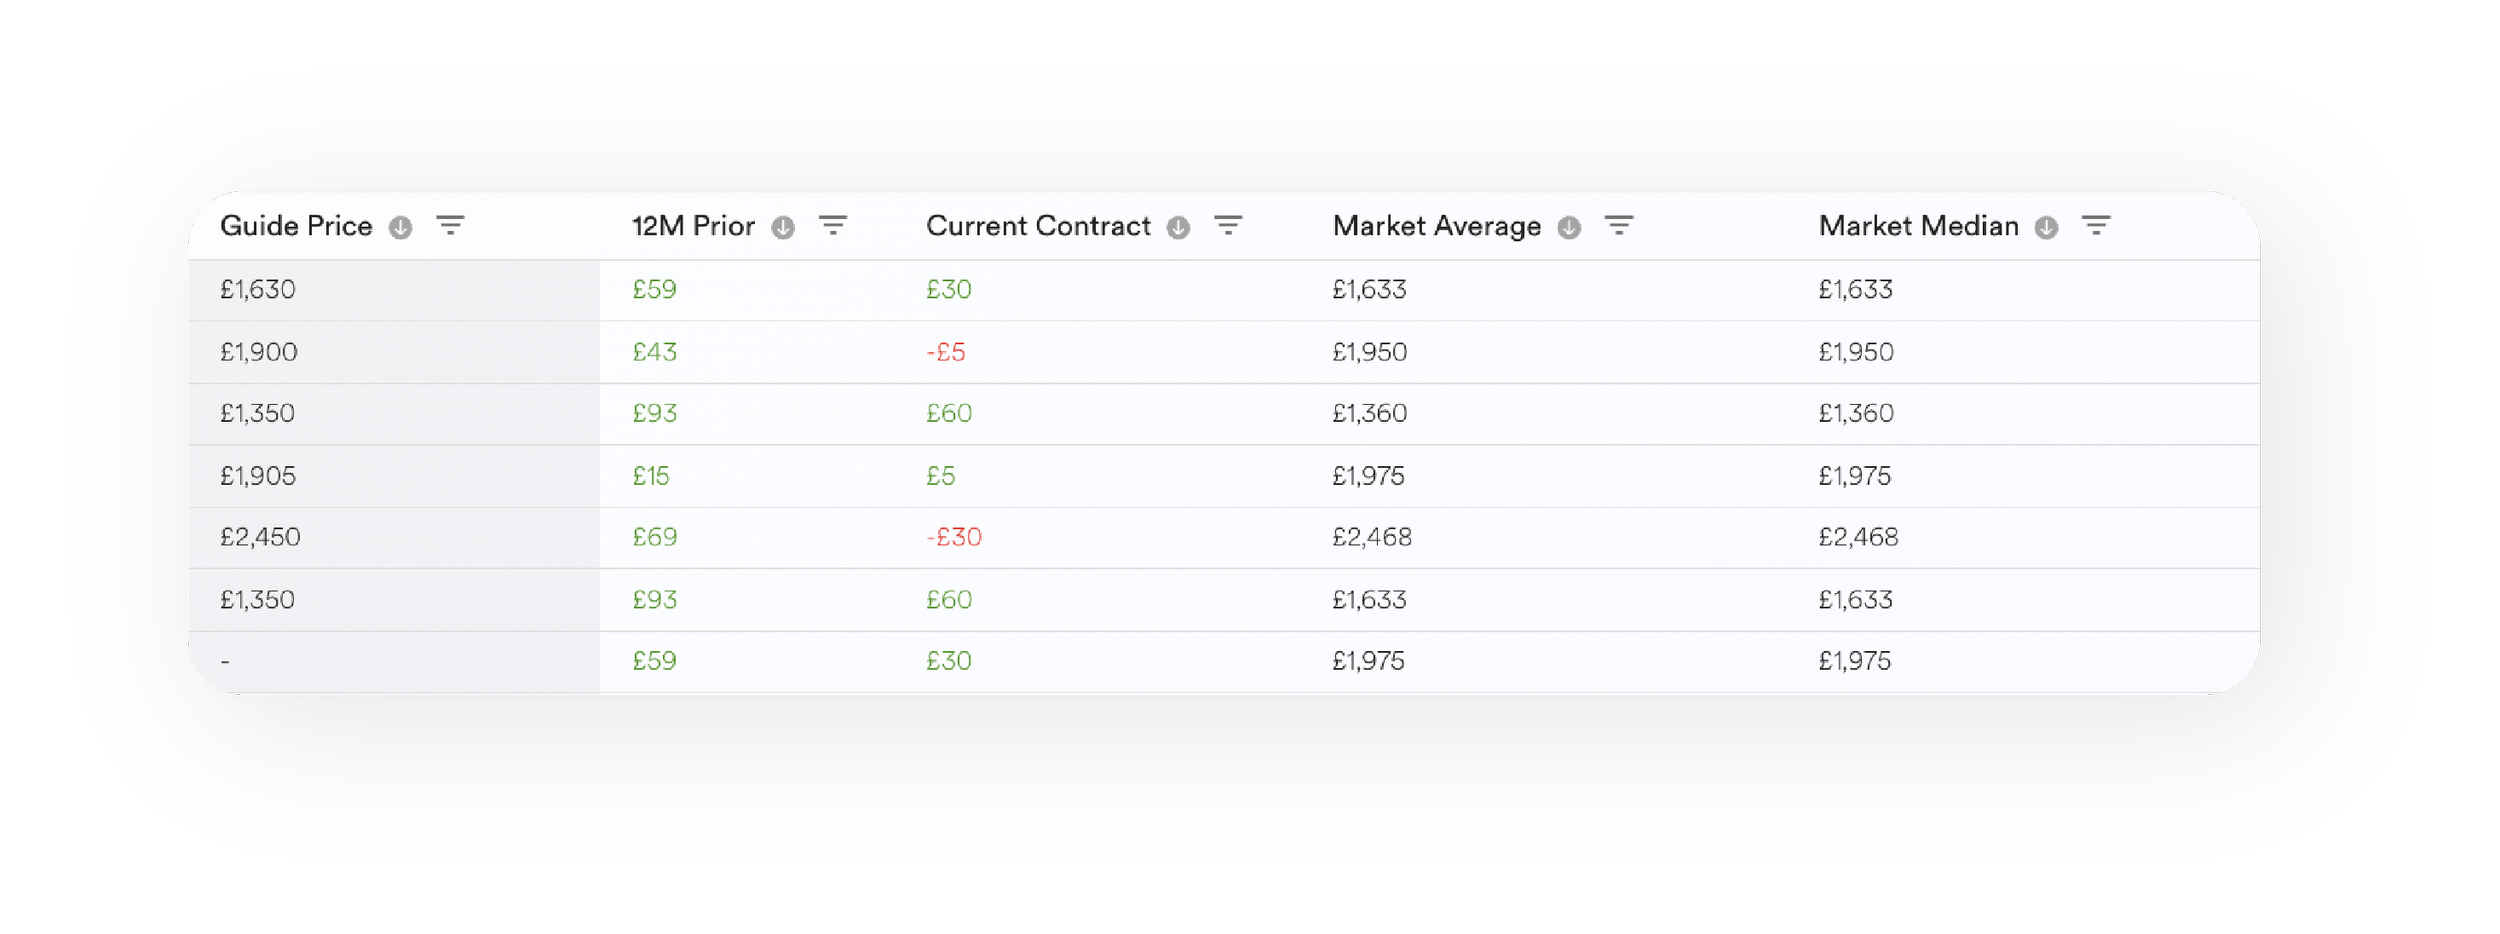
Screenshot of a banking or financial app interface with four rows of currency transactions, each indicating different amounts and account identifiers.

Rent Review Support

Support and defend rent reviews with clear pricing comparisons, market data, and a resident-ready summary PDF.

Illustration of a search and filter process with checkboxes, a magnifying glass, and a location pin.

Market insight

Access locally achieved rents, demographic data, and market trends to benchmark pricing and validate decisions.

A digital device screen with a progress bar showing high loading status, and a smaller progress indicator at the bottom with a gradient fill from peach to light pink.

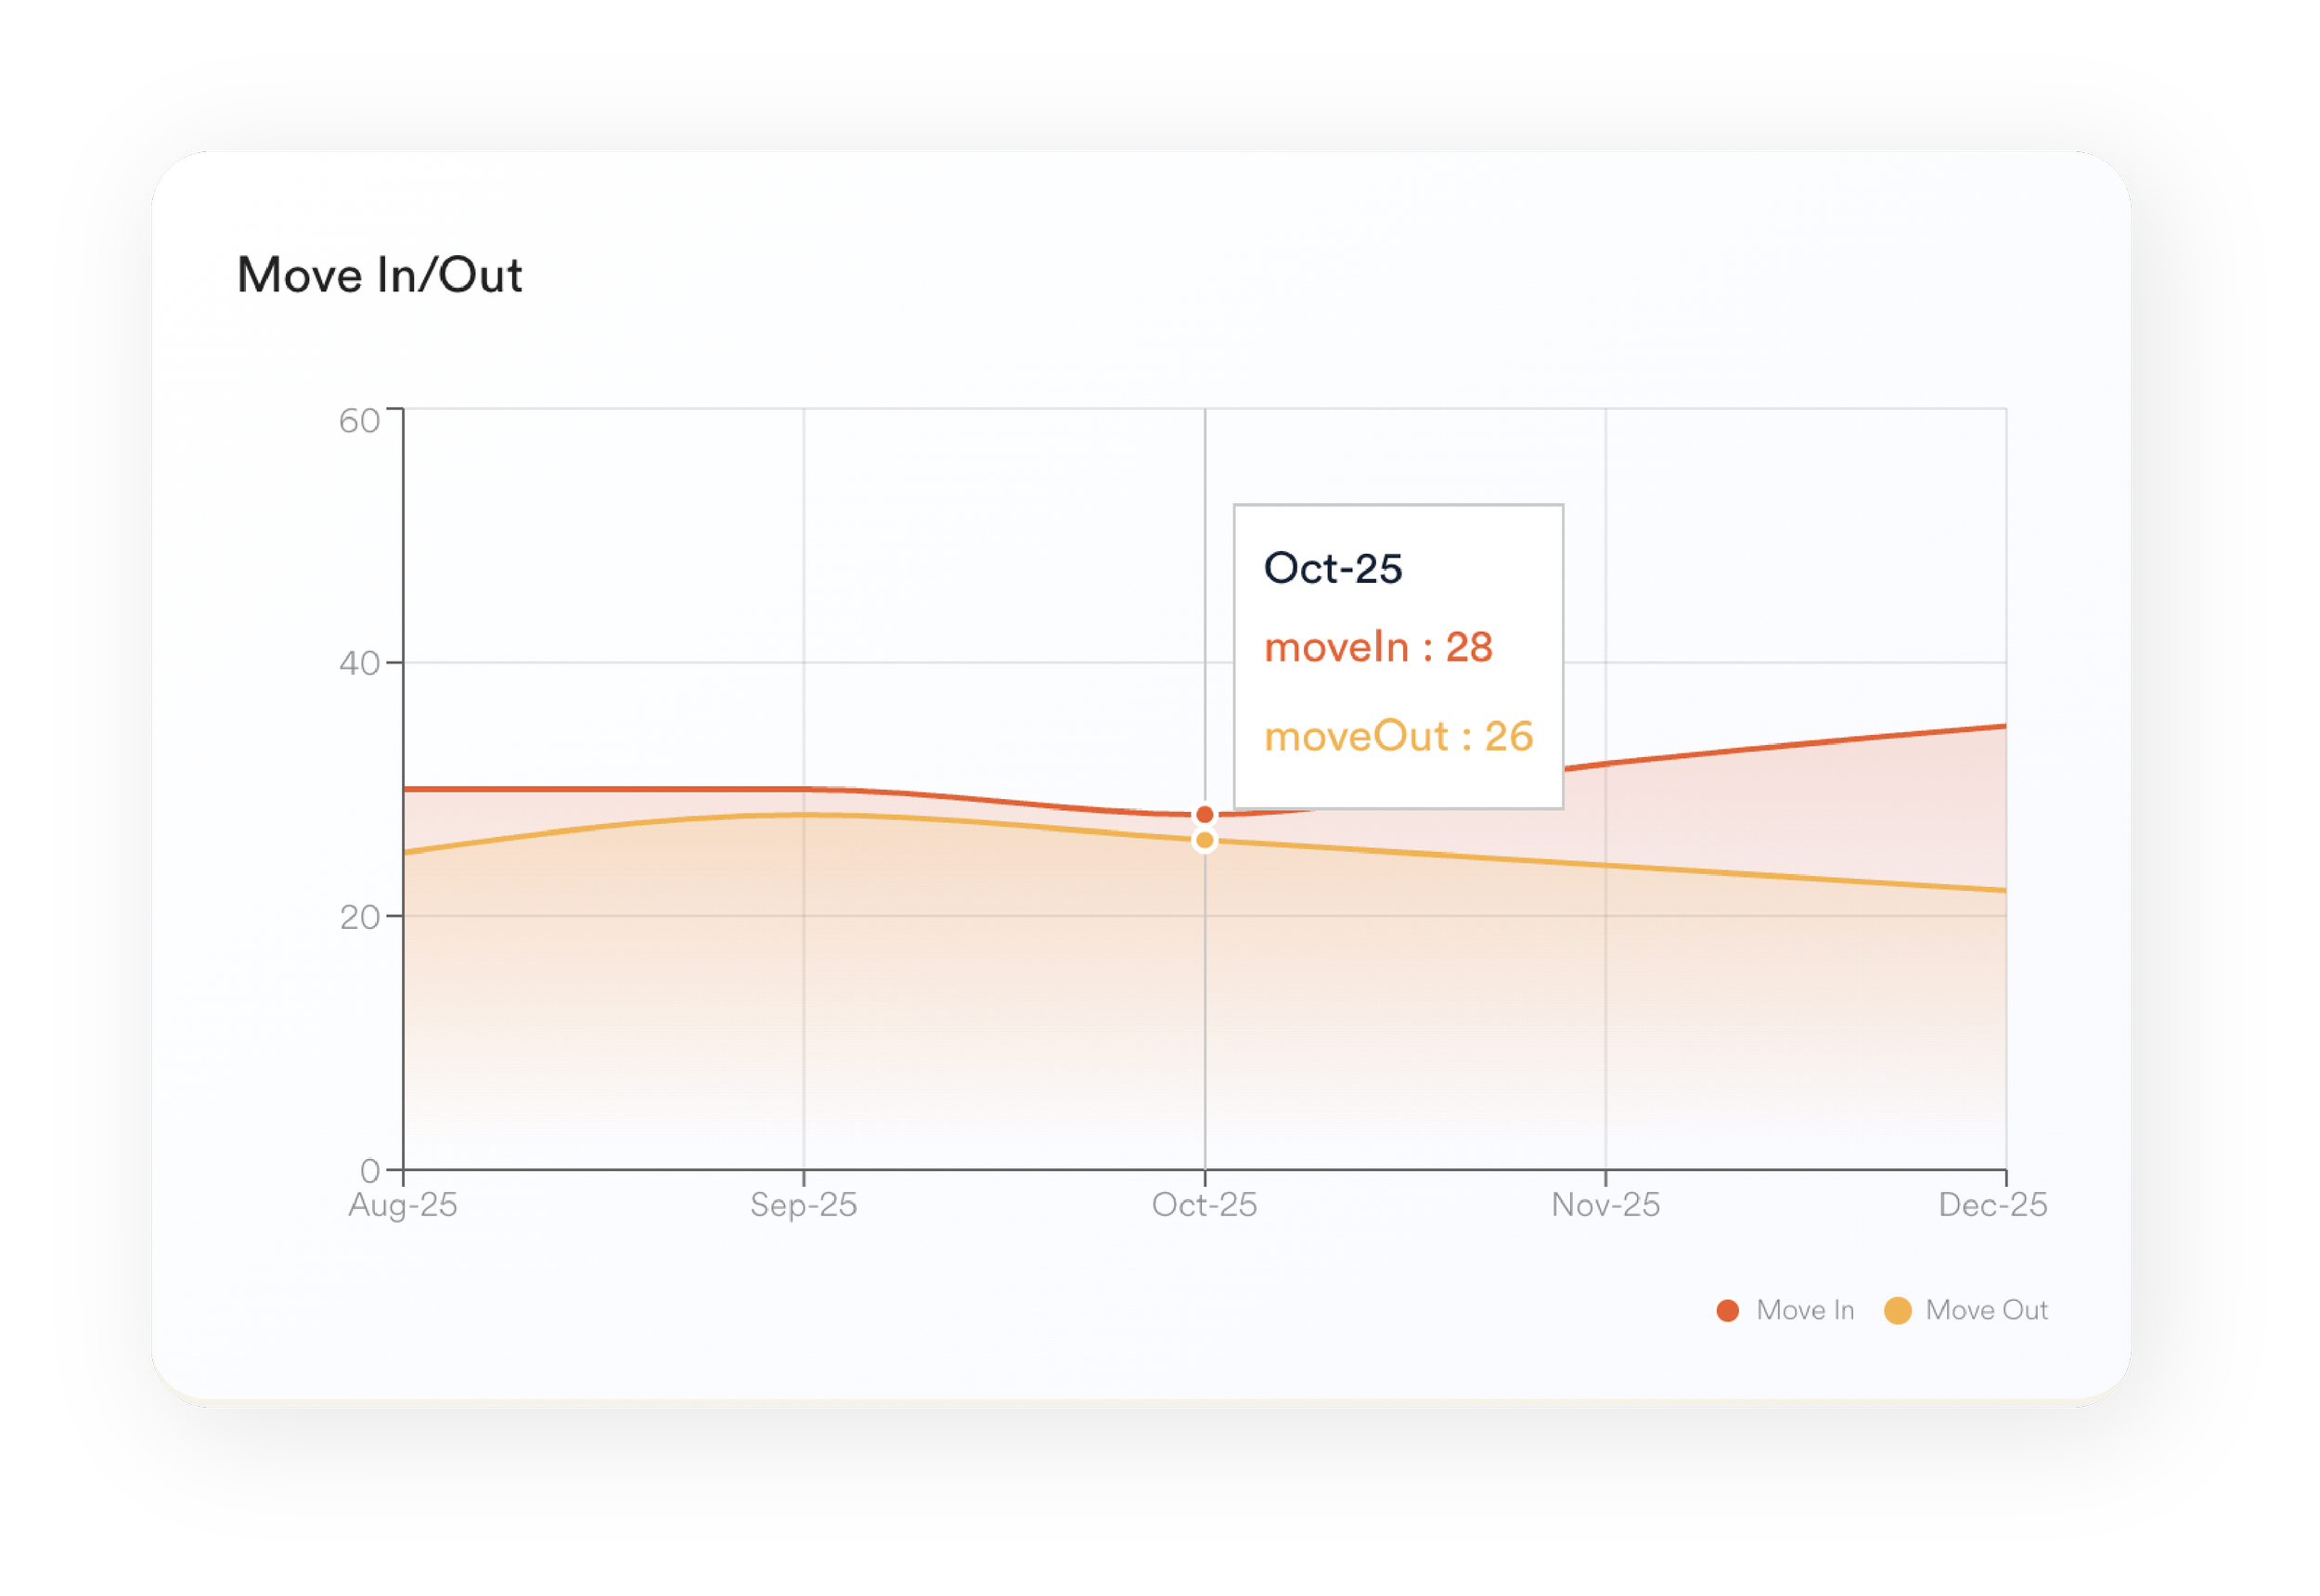
Performance dashboard

Track portfolio performance, leasing activity, and risk through real-time, intuitive dashboards.

Screenshot of a data dashboard with various bar and line charts, featuring green, orange, and red color schemes, and interface elements like menu and navigation bars.

Pricing Strategies & Rules

Define pricing strategies with configurable rules across portfolio, property, and unit levels.

Screenshot of a budgeting or expense tracking app showing a total amount of £520. It includes checkmarks, sliders, and labels for different categories or items.

Approval Workflows

Manage pricing changes through structured approvals with clear ownership and full audit history.

Screenshot of a data table or form with three rows, each containing a green circle, gray text fields, a checked checkbox, and an unchecked checkbox, on an orange background.

Customer reports

No more spreadsheets. Build and share custom reports using any of your data - tailored to your needs.

A to-do checklist with five items, each with orange checkboxes showing they are completed, and green status indicators next to each item, along with plus icons for adding new tasks.

Figtree’s AI Assistant

Interact with your data through natural language - ask questions, explore performance, and surface insights instantly.

Close-up of an orange and cream-colored geometric Yin-Yang symbol on a background of orange.

Shaped by a decade of experience working with leading BTR operators and asset managers

Purpose-built to move beyond spreadsheets and manual analysis

End-to-end pricing workflow, from strategy to execution

Seamless integration with your property management system

A laptop on an orange textured surface displaying a software dashboard with a sidebar menu and various options.
Map of London with a highlighted route passing through Camden Town, Finsbury Park, Hackney, and Stratford.
A digital interface screen displaying an overview tab with data including total units, leased, occupied, vacant rented, vacant available, shown in tabular format with percentages.
A digital table showing financial data including guide price, 12 months prior value, current contract value, market average, and market median, with some figures highlighted in green and red.
Screenshot of a property management spreadsheet showing details of apartment units in a building, including building name, unit number, types, status, available date, and floor plan links.
Line graph showing move in and move out data over several months, with specific data points highlighted for October 25, indicating move in: 28 and move out: 26.
Cyber Essentials Certified badge with a checkmark

Institutional-grade security and infrastructure

Figtree is built on resilient, cloud-native infrastructure with customer data fully ringfenced by design. With encrypted storage, strict access controls, and institutional-grade governance, every interaction is secure, auditable, and compliant.

Side profile of a man with curly dark hair and a beard, wearing a beige sweatshirt, looking downward against a plain background.
A black and white icon of a leaf on a dark background.

Customer success from day one

With guided onboarding to get you live in weeks and ongoing support that drives long-term success. 

Experienced team with deep operational expertise

Built-in process guides and FAQs

AI assistant providing instant insights and guidance

365-day support

Black square with a leaf icon in the center.
A graphic with dark background and orange accents displaying a futuristic design.

Request a demo