Maximise Revenue. Increase Control.

The revenue management platform built for BTR, shaped by industry

Logo with a white leaf shape on an orange gradient background
Vertical side menu with icons for home, applications, analytics, reports, documents, buildings, checklist, heart, question mark, and settings.
Search bar with a magnifying glass icon and placeholder text 'Search for anything here...'
A digital calendar with the date range August 25 to December 25.
Map showing a section of London with a highlighted route connecting Camden Town, Finsbury Park, Hackney, and Stratford.
A table showing financial data with columns labeled Guide Price, 12M Prior, Current Contract, Market Average, and Market Median, including values in GBP, some cells highlighted with green or red indicating positive or negative changes.
Screenshot of a data table with categories like 'Overview,' 'Status,' and subcategories such as 'Total Units,' 'Leased,' and 'Occupied.' The numbers and percentages are visible next to each category.
A line graph showing move-in and move-out data over several months, with date markers from August to December. The graph has two lines, one red for move-in and one yellow for move-out, with a tooltip indicating specific data points for October 25.
Screenshot of a black background with a white prompt box in the center that says 'Draw Custom Area' with a drawing icon next to the text.
Close-up of a dropdown menu labeled 'Sector' with a downward arrow indicating options.
Screenshot of a user interface with a 'Compare Property' dropdown menu in the center on a black background.
A person working on a laptop displaying a spreadsheet with columns of data. There's a potted plant on the desk.
A black leaf icon on a dark background.

Pricing is still a manual process

Pricing decisions are spreadsheet-driven and based on limited insight from manual data analysis.

This results in:


Slow reaction to demand shifts


Inconsistent decisions across teams


Time lost in internal debate


Missed revenue

Close-up of textured coral and cream-colored abstract pattern with curved lines.

Pricing speed and effectiveness is now a competitive advantage

Which is increasingly important due to:


Higher need to convert demand quickly


Greater pressure to achieve NOI


RRA requirement to evidence fair rent setting


Increased competition and renter choice


Black leaf logo on a dark background
An iMac computer displaying a real estate management dashboard on a wooden desk, with a wireless keyboard and mouse, against a wood-paneled wall.

A smarter way to manage pricing

Figtree provides a centralised revenue management tool that maximises rental income while ensuring consistent, fair and controlled pricing across your portfolio.

This results in:


Consistent pricing execution across teams and assets


Maximised revenue through optimised pricing


Greater control, transparency, and governance


Faster, data-led pricing decisions


Silhouette of a leaf or leaf-shaped object on a dark background.
A person holding a plate of food on their lap while sitting on a couch

Here’s how it works…

Right arrow icon on a dark gray circular background.

Data integration with your existing PMS

Seamless PMS integration via API or SFTP, ingesting leasing and demand data with optional price push-back.

Black circular icon with a white right arrow

Machine Learning Demand Forecasting

Our machine learning model analyses your demand data to identify the optimal price for every unit, continuously improving its accuracy over time.

Right arrow icon on a black circular background.

Strategy-Led Pricing Decisions

Forecasts are converted into clear, actionable rents using your strategy, rules and guardrails—balancing optimisation with control.

Black circular button with a white right arrow icon in the center.

Performance Insights & Pricing Explainability

Access performance insights and explore pricing via Figtree’s AI assistant, with full visibility into the drivers behind every price.

A blurred gradient background with shades of orange, yellow, and white.
Screenshot of a software interface displaying pricing rules for a property management platform, with options for pricing strategy, stability/risk profile, occupancy vs rental value weighting, price change frequency, and pricing factors, mostly selected or enabled.
A black icon with a leaf symbol on a gray background.

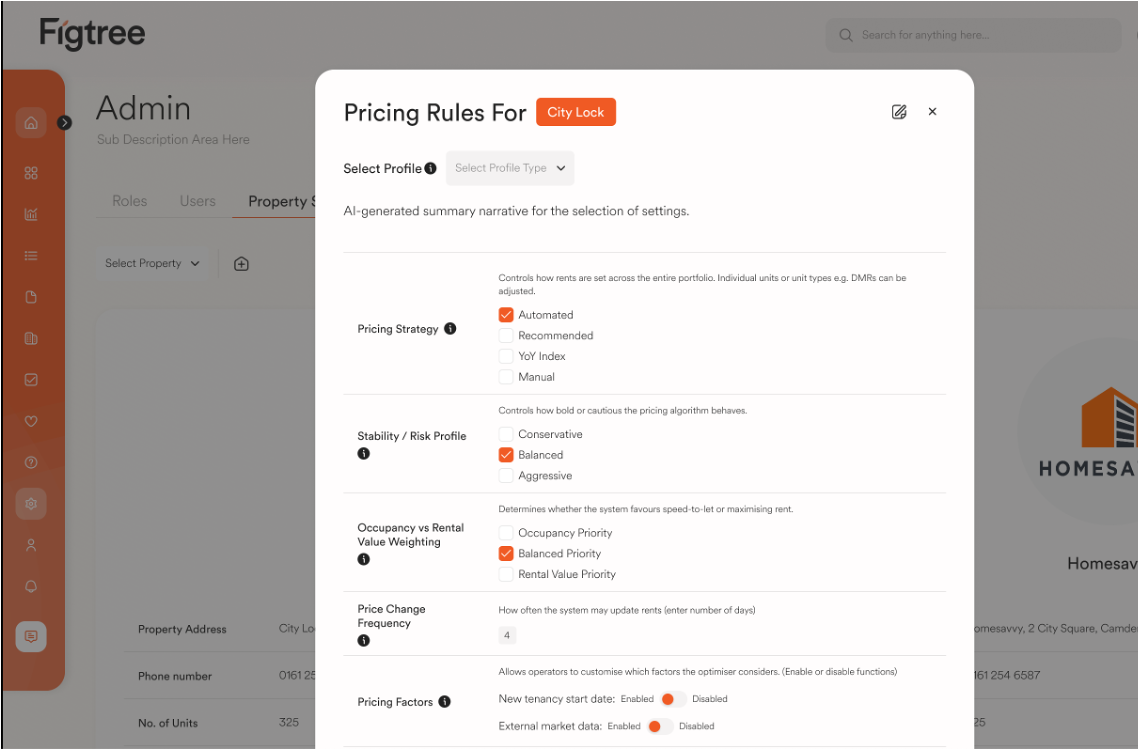
A new standard of pricing governance

  • Automated, rules-based pricing strategies

  • Configurable risk and stability profiles

  • Occupancy vs rent weighting controls

  • Configurable price change frequency

  • Pricing guardrails (floors, hierarchy, cooling-off)

  • Custom market comparison rules

  • Approval workflows for pricing changes

  • Full version history and audit trail

Blurred background with warm orange and yellow hues, no distinguishable objects.
Screenshot of a property management software called Figtree showing availability status, property details, and sorting options.
Black icon of a leaf on a gray background

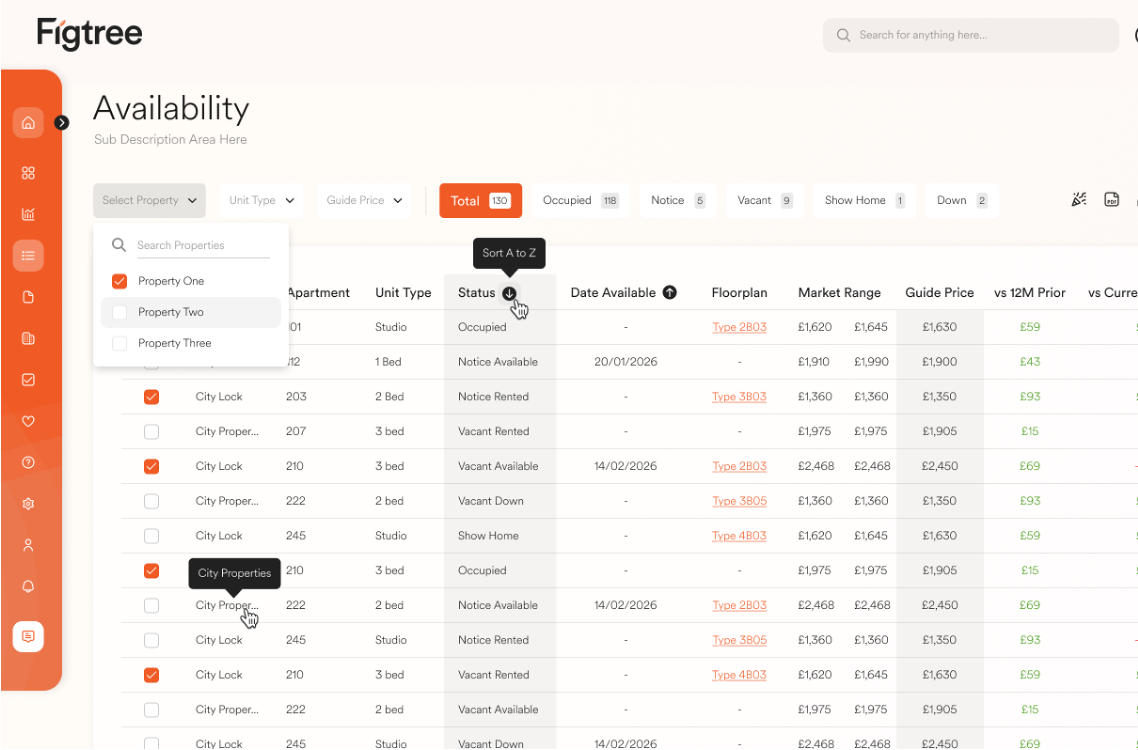
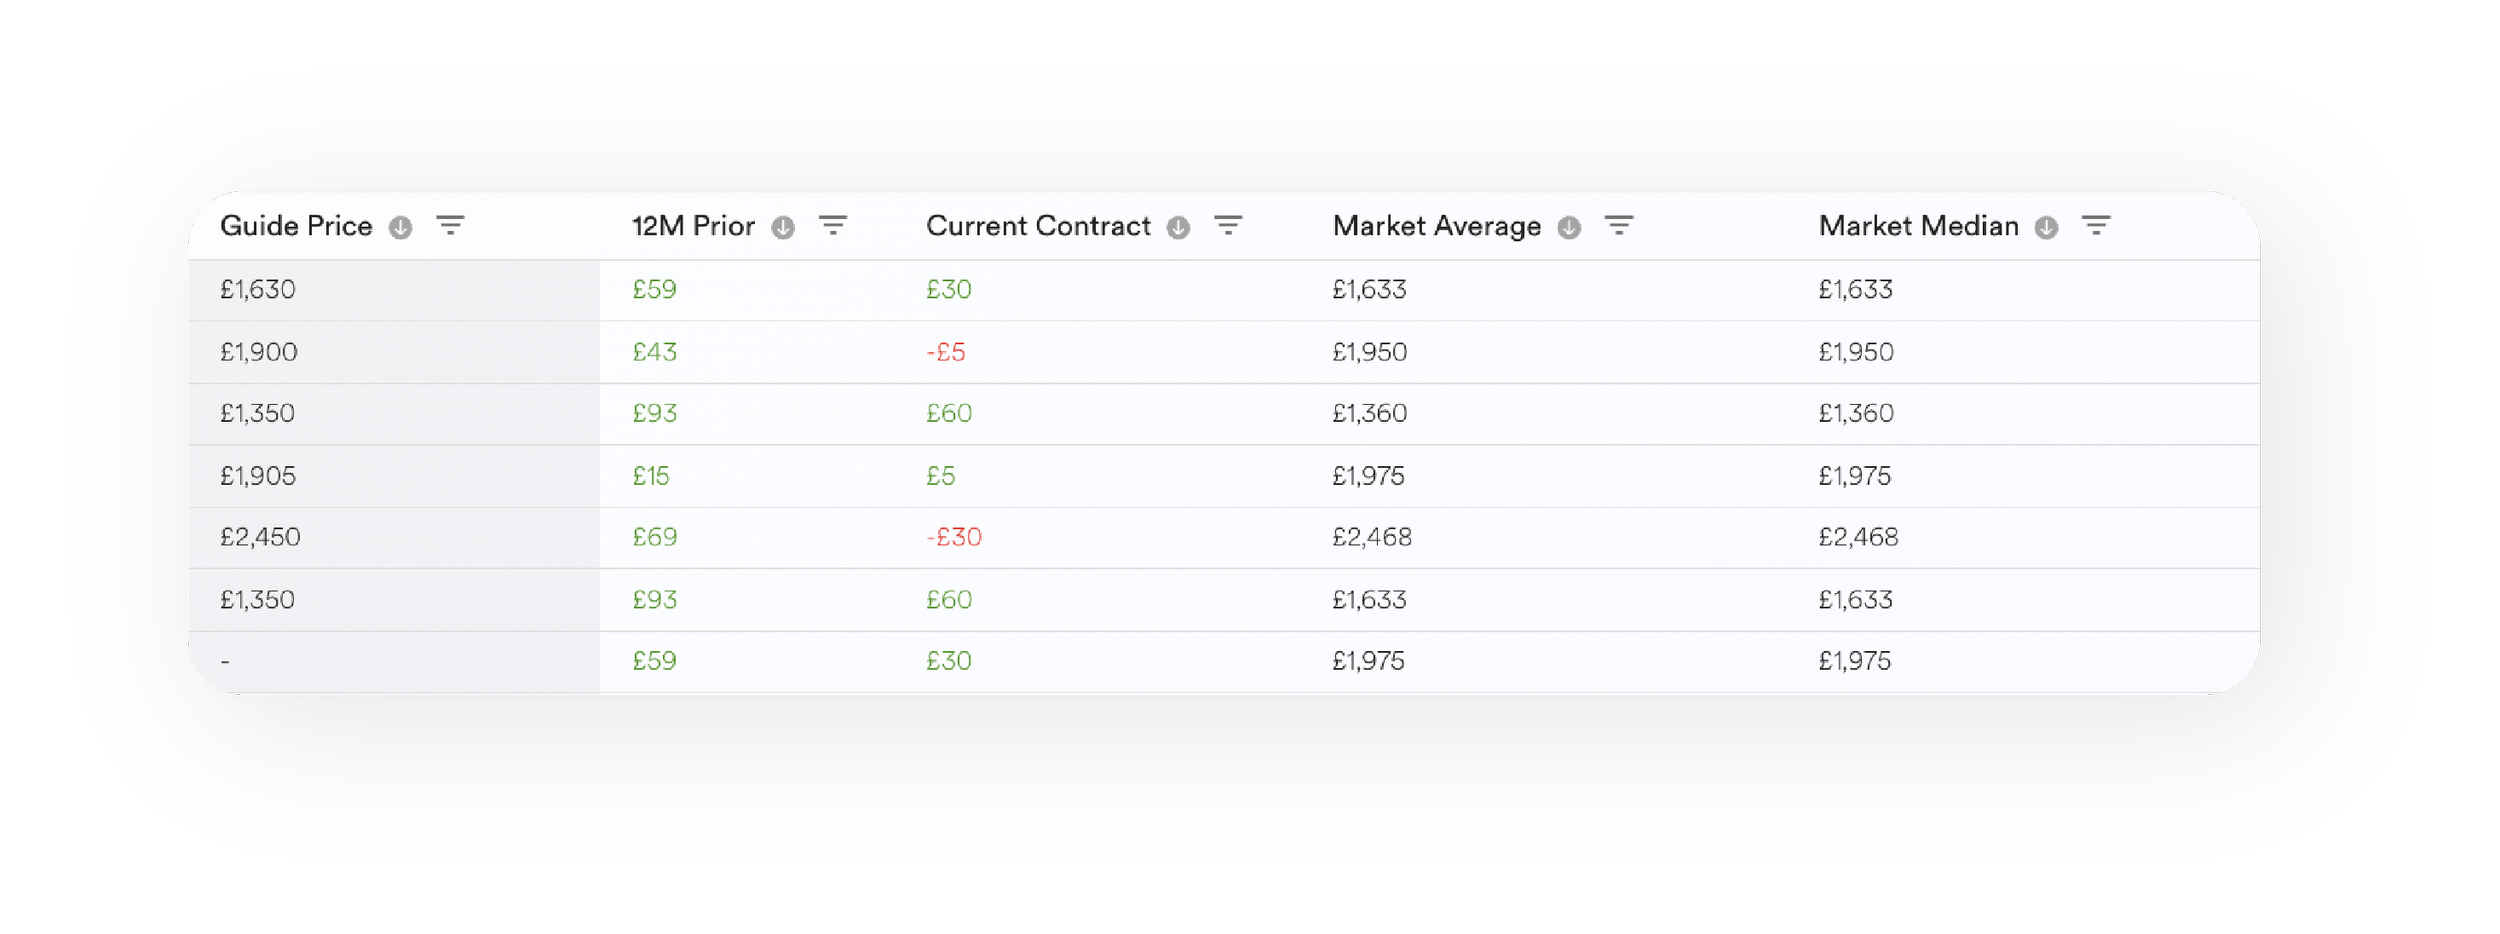
Optimised pricing for every unit

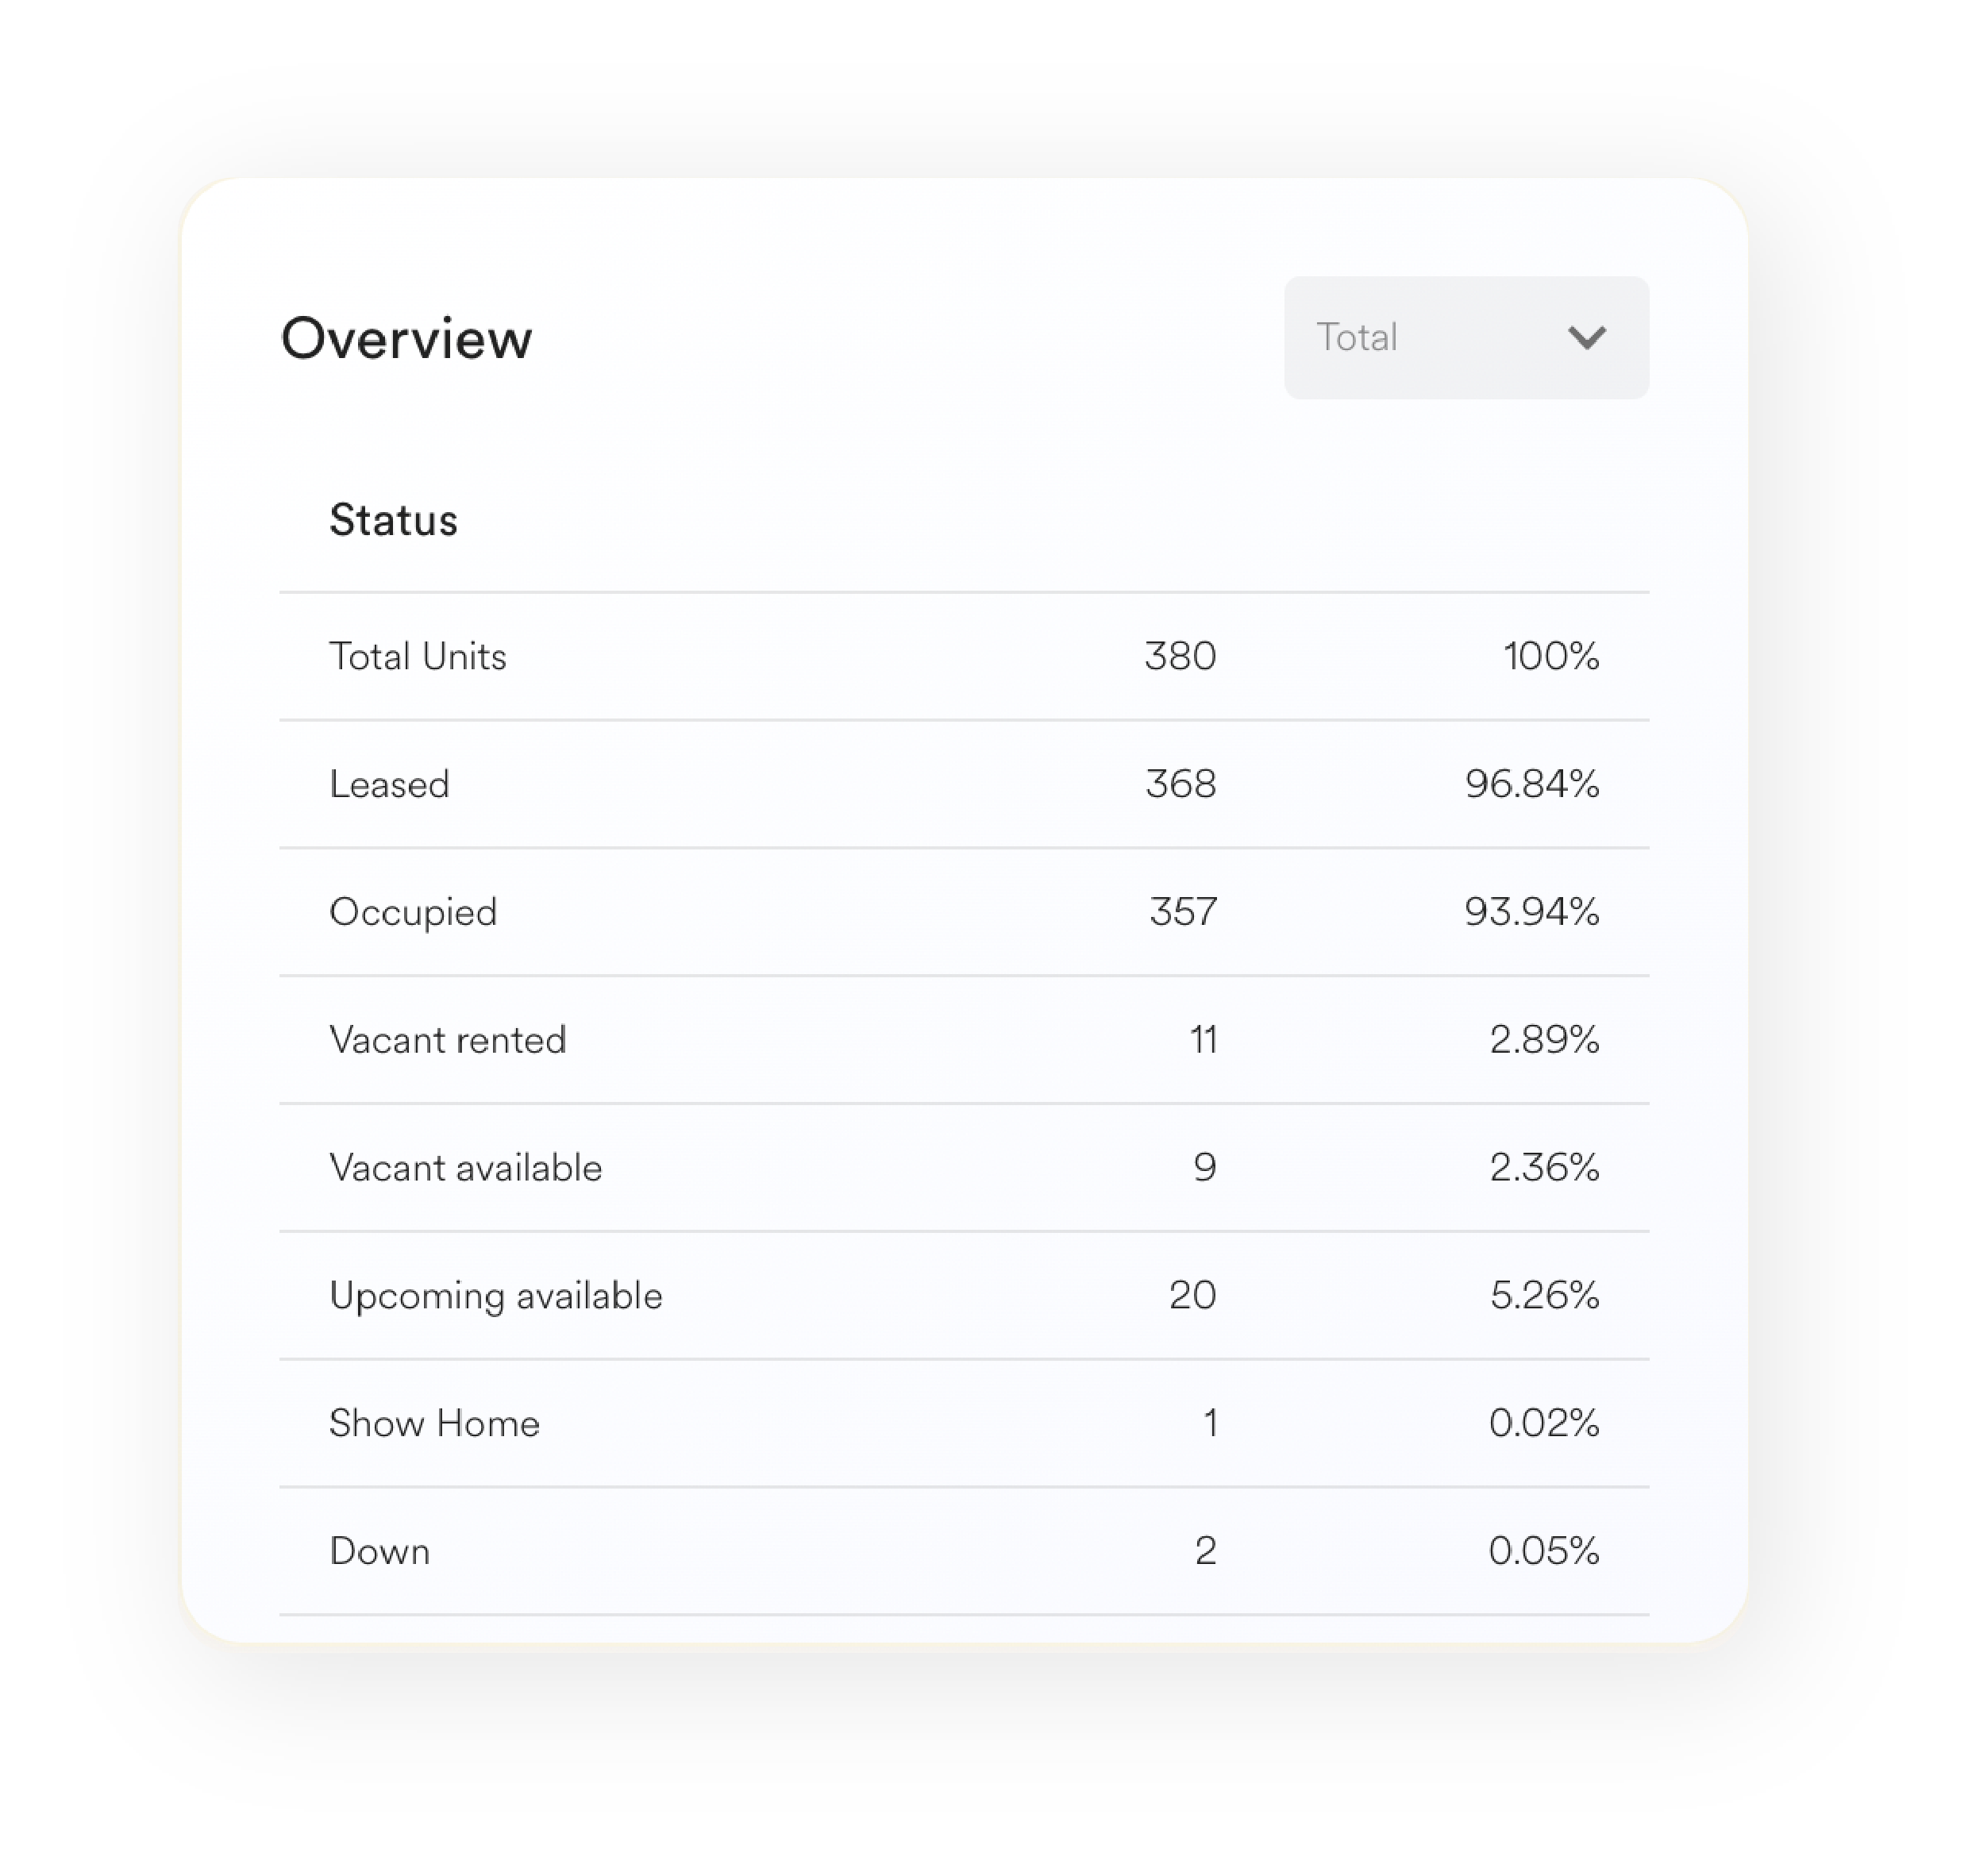
  • Live unit status across the portfolio

  • Complete unit attributes for filtering and comparison

  • Strategy-led guide pricing

  • Unit-level pricing rules and controls

  • Pricing context vs YoY, last let, and market

  • One-click pending reservation

  • Branded PDF quote generation

  • Sharing and export controls

Blurred image with a gradient from light yellow to orange.
Map of London with highlighted route passing through Camden Town, Finsbury Park, and Stratford.
Screenshot of Figtree dashboard showing Market Insights with a line graph labeled 'Move In/Out' and a sidebar with icons.
Green leaf icon on black background

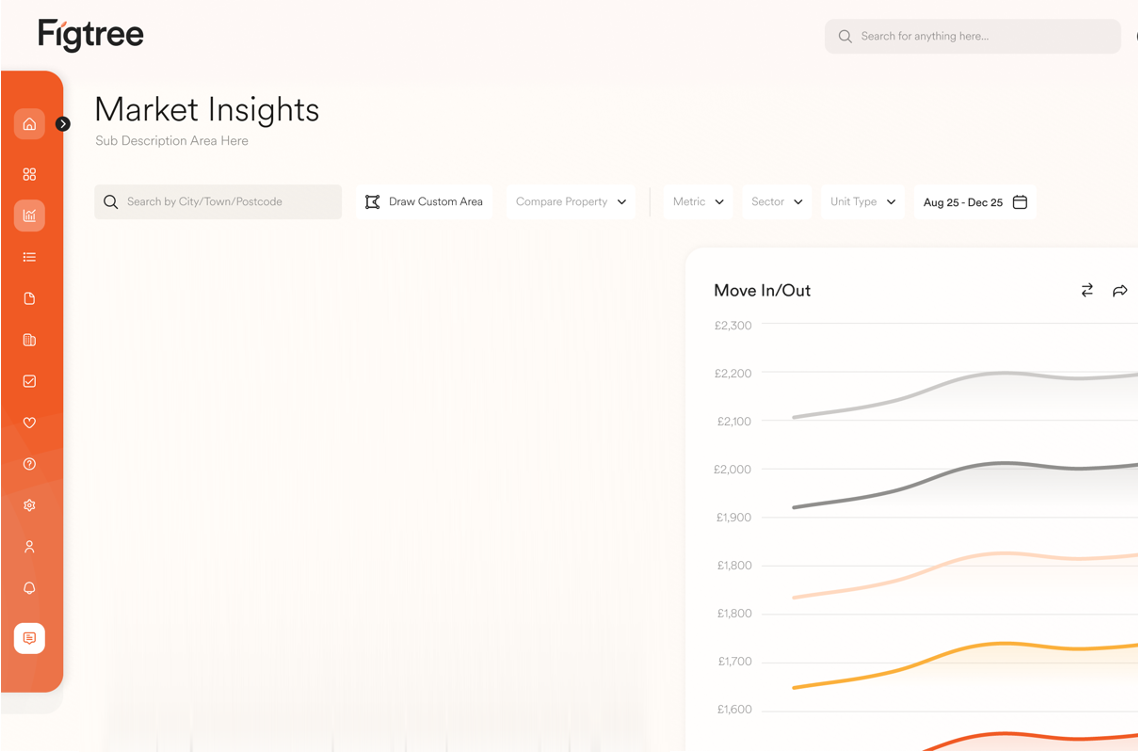
Price with confidence using market context

  • Custom market areas drawn by postcode, town, or map boundary

  • Live achieved pricing by unit type

  • Real demographic data showing who rents in the local area

  • Overlay your property to benchmark against the wider market

  • Adjustable time ranges for pricing validation

  • Shareable, exportable market insights for faster decisions

Close-up of a hand holding a smartphone with a blurred orange and yellow background.
Dashboard from Figtree property management platform showing performance metrics for rental income, rental growth, average achieved rent for different unit types, and a graphical revenue report with a table of average rent prices per month.
Silhouette of a leaf on a dark background

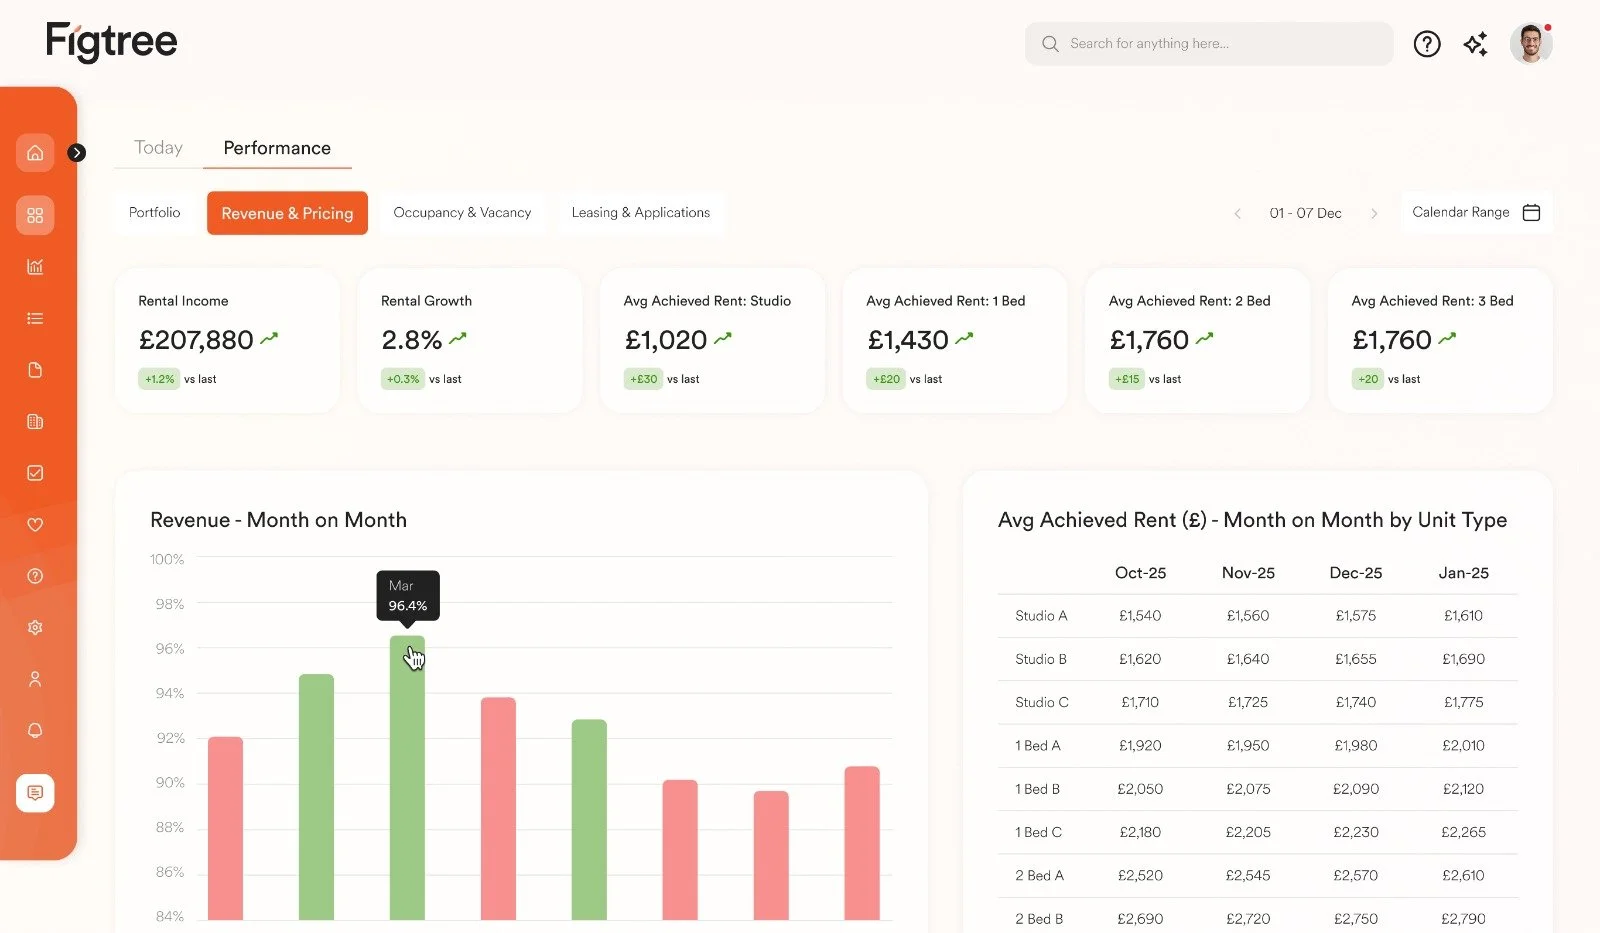
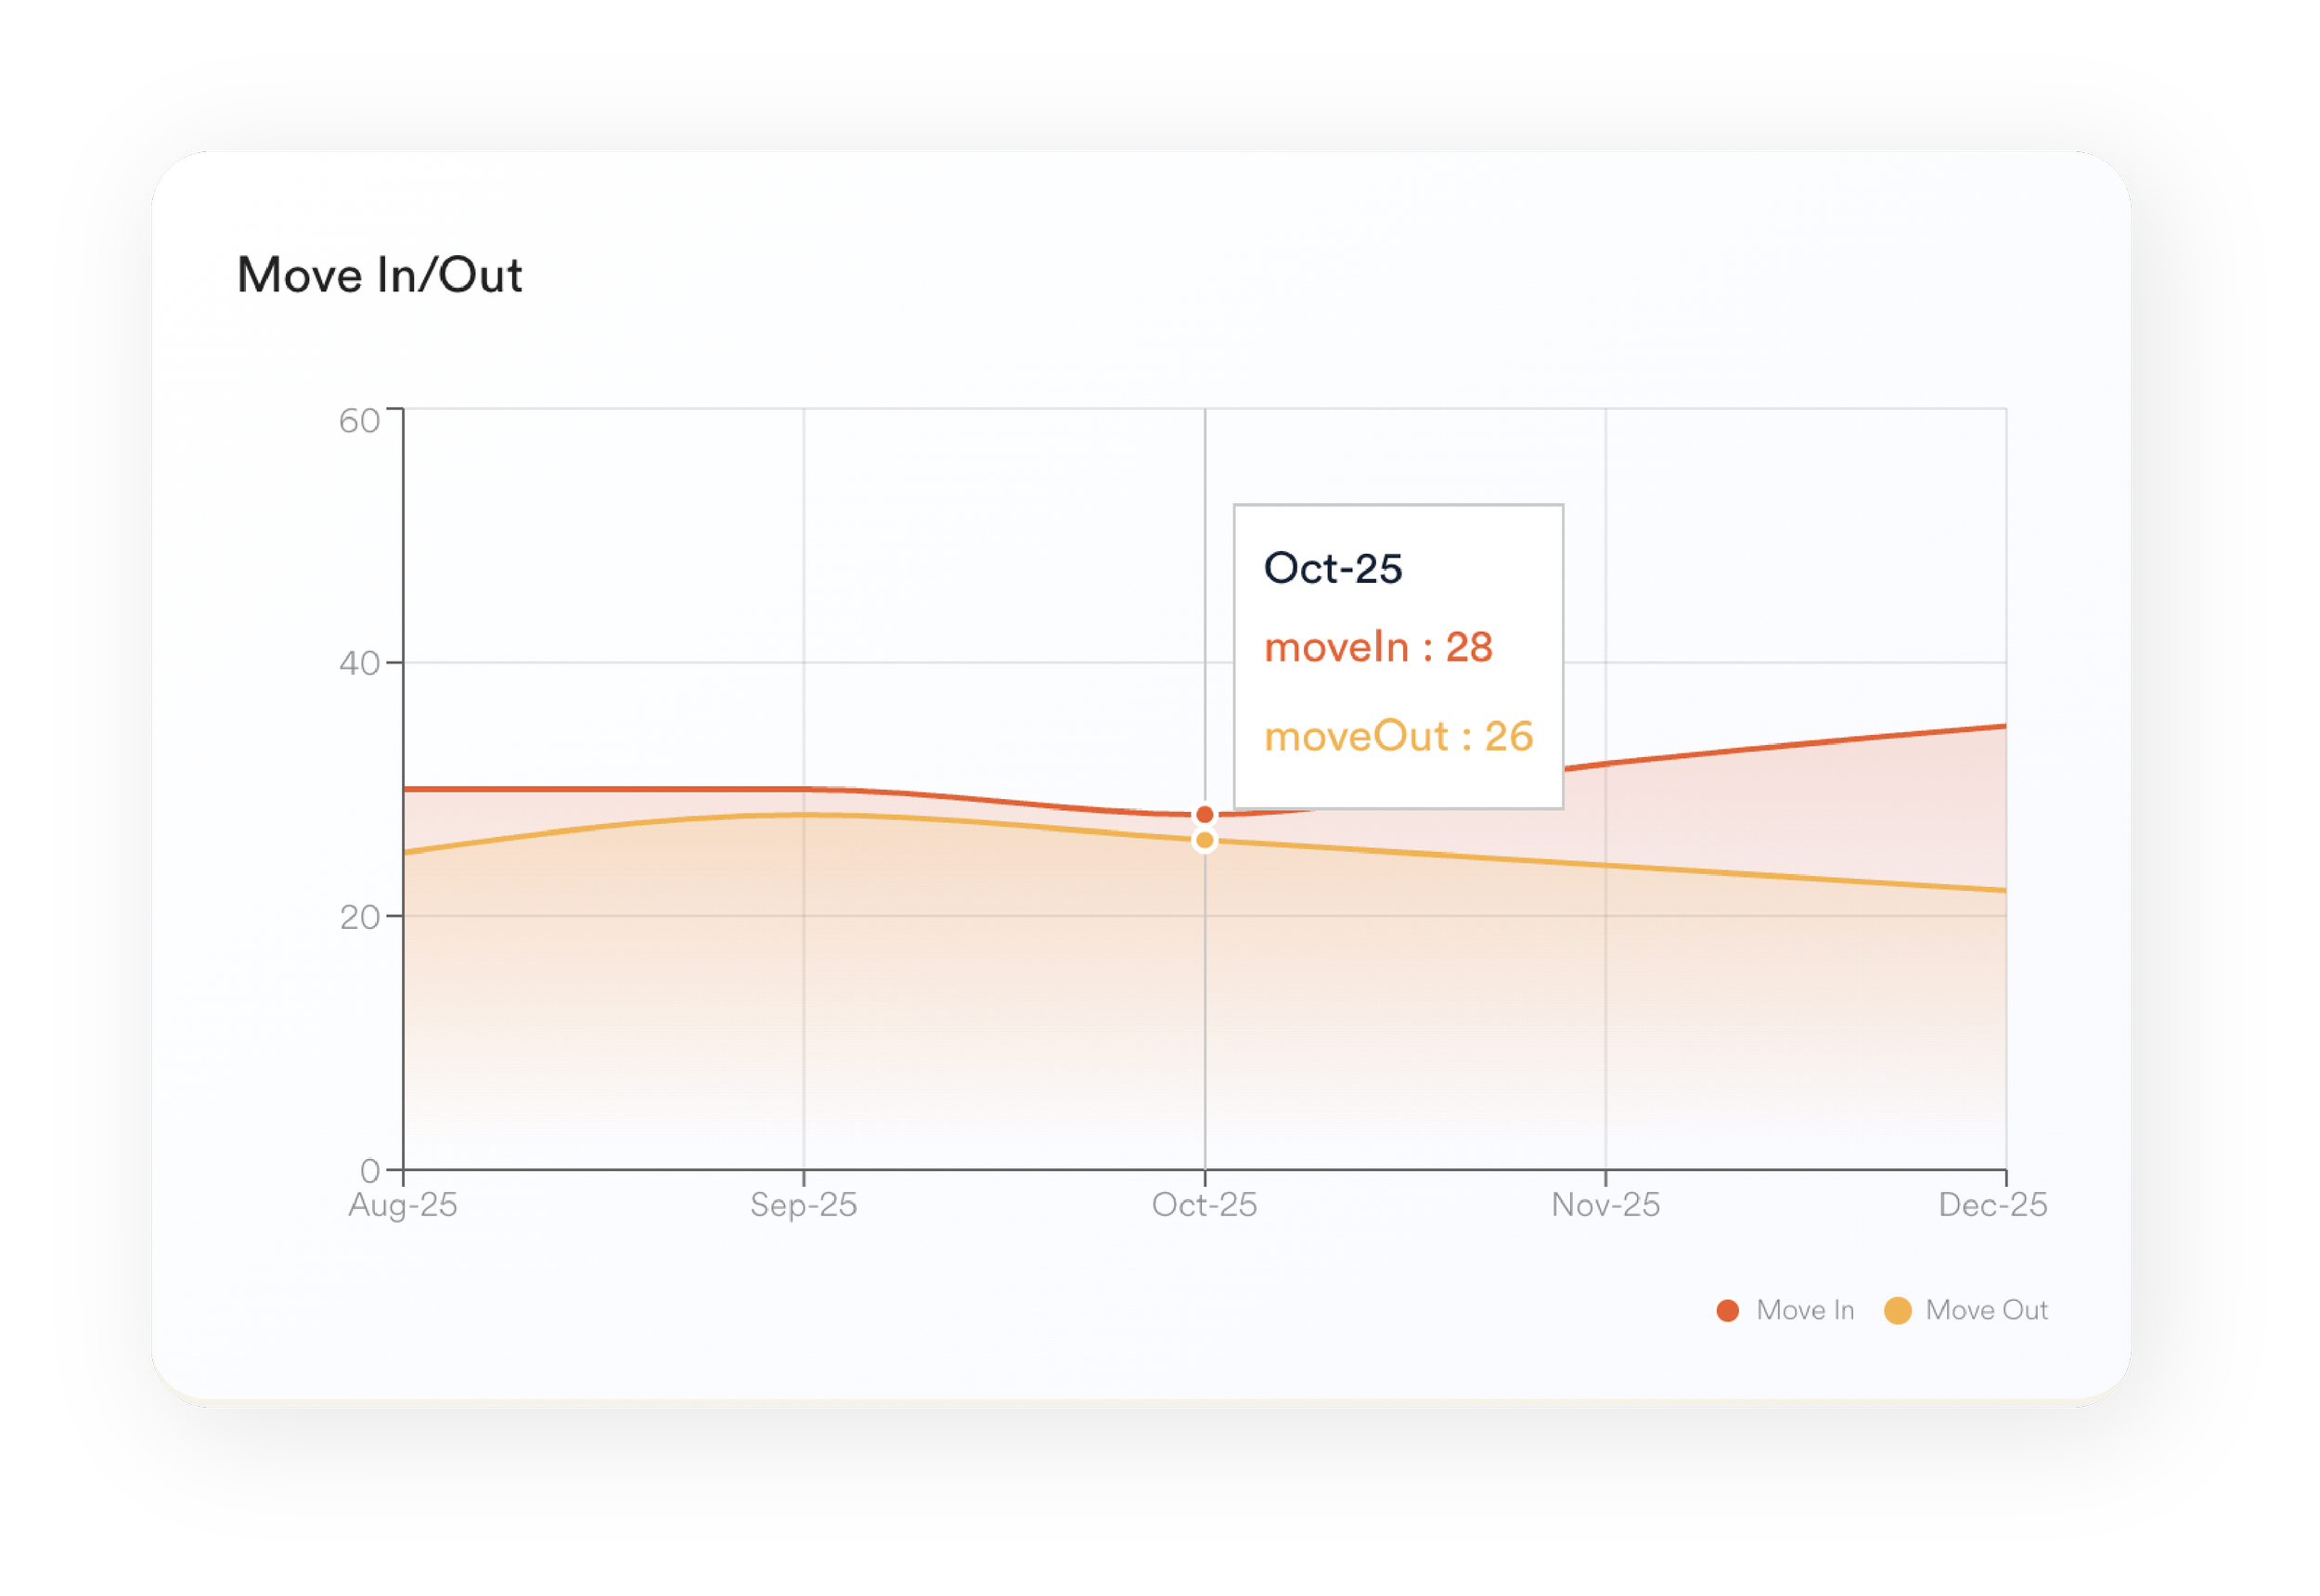
Turn data into insight and action

  • Real-time portfolio dashboards for performance and risk

  • Demand forecasting and trend analysis

  • Custom reporting across properties and portfolios

  • Scheduled reports for automated updates

  • Simple sharing and export

  • AI assistant for instant insights and discussion

Why Figtree?

Purpose-built to move beyond spreadsheets and manual analysis

End-to-end pricing workflow, from strategy to execution

Orange background with a white leaf icon in the center

Faster decisions with clear governance

Designed to work alongside your existing PMS

Why Figtree?

Purpose-built to move beyond spreadsheets and manual analysis

Faster decisions with clear governance

End-to-end pricing workflow, from strategy to execution

Designed to work alongside your existing PMS

Black icon with a leaf symbol on dark background.

Built for operators across every rental model

Icon of a multi-level search server or database

Build-To-Rent

Icon representing a group of people, with one person in the foreground and others in the background.

Co-Living

Silhouette of a graduation cap and diploma.

PBSA

Icon of a house with a chimney and two windows.

Single Family Homes

Black and gray leaf icon on a black background.

Later Living

White leaf symbol on a black background

The impact for our customers

Two beige armchairs with a small round wooden table between them, set in front of large windows with a city skyline view.

Increased revenue from optimised pricing

A modern open-plan living and dining area with a dining table, chairs, a TV mounted on a patterned accent wall, and various decorative elements including plants and lighting fixtures.

Faster response to demand shifts and market changes

A cozy living room with a cream armchair with brown pillows, a small black side table with books, and purple curtains covering a window.

Less internal debate, clearer pricing decisions

Living room with modern decor, gray sofa, potted green plant, striped accent wall, and kitchen area with white cabinets and small decorative items.

Greater confidence and governance at scale

Black icon of a leaf on a square background

What this means for your portfolio


Occupancy Growth

1%

2%

3%

4%

5%

Additional Revenue

£86.4k

£172.8k

£259.2k

£345.6k

£432k

Reduced Void Costs

£17.5k

£35k

£52.6k

£70.1k

£87.6k

Total Annual Value

£207.8k

£519.6k

£311.8k

£415.7k

£103.9k


Small improvements in occupancy can deliver significant financial returns.

Here's what that could look like for a portfolio of 400 homes, based on an average rent of £1,800 per month and average void costs of £12 per day.

Black icon with a leaf shape on a dark background.

Customer success from day one

With guided onboarding to get you live in weeks:


Icon of an upload arrow within a square.

Upload assets, connect data sources, and configure rules


Placeholder or user avatar icon, gray outline of a person on a black background.

Onboard users, align teams, and ensure day-one adoption


A gear icon inside a partial circular arrow, representing settings or system configuration.

Validate outputs and refine settings before rollout

And ongoing support that drives long-term success:


Line chart with three points connected by lines, showing an upward trend

Built-in process guides and FAQs


Line drawing of a light bulb with a filament inside

Experienced team with deep operational expertise


Shiny star-shaped sparkle with multiple points and a bright reflection.

AI assistant providing 24/7 insights and guidance


Icon of headphones with a microphone

365-day support with clear SLAs

Enterprise-grade security and infrastructure


Cloud-native, resilient infrastructure built on AWS


AI capabilities powered by OpenAI and Amazon SageMaker


Auto-scaling, serverless architecture designed for peak demand, with a 99.9% uptime target


Secure, encrypted data storage with UK/EU regional residency


Clear data ownership and landlord segregation by design


Automated backups and disaster recovery


Institutional-grade governance, traceability, and auditability


Role-based access controls and approval workflows


Multi-factor authentication and single sign-on (SSO) as standard


GDPR-compliant by design


Secure APIs with controlled, monitored integrations


Cyber Essentials Certified

Gray leaf icon on a dark background

Simple, transparent subscription pricing

Close-up of a light-colored wooden surface with a warm tone.

Free

onboarding

Close-up of a wooden surface with warm lighting, possibly a table or desk.

Unlimited

users

Close-up of a wooden surface with warm orange lighting.

£40/unit

per annum (ex VAT)

A black square with a leaf silhouette in the center

Getting started is straightforward

We handle the setup and take you through a structured onboarding journey to get you live quickly, with full visibility and support at every stage.

Stage 1

Pilot delivery plan

Stage 2

Platform setup & data integration

Stage 3

Pricing output validation

Stage 4

Platform training & enablement

Stage 5

Pilot launch

Stage 6

Pilot review & scale decision

Shaped by a decade of experience working with leading BTR operators and asset managers


George Ahye
Co-Founder & CEO

10+ years BTR operations experience at urbanbubble, Greystar and Get Living. ARLA, IRPM, IOSH qualified

A man with dark hair and a beard, wearing a dark jacket, standing outdoors with a background of trees and a cloudy sky.

Shezan Nabiel
Co-Founder & CTO

Mechanical Engineering (BEng) (Hons), experienced tech entrepreneur with 8+ years in software engineering

Portrait of a man with dark hair, beard, wearing a dark blazer and white shirt, against a neutral background.

Ed Thomas
Co-Founder

12+ years BTR CX strategy with DTZi, Folk, The Collective, Apache Capital, Heimstaden

Man with red hair and beard smiling, wearing a light blue button-up shirt, in an office setting.

Niclas Thomas
Data Science Consultant

MMath Mathematics, PhD Machine Learning, former Head of Data at Sainsbury’s, Gousto, Next

A headshot of a man with short brown hair, smiling, against a plain light background.

Jamie Matlock
Data Engineering Consultant

10+ years in data architecture, security, and analytics; Head of Data at a leading identity verification and fraud prevention platform

Black and white portrait of a young man with short dark hair, wearing a blazer over a t-shirt, smiling.

Q Ventures
Investor

Venture Capital firm with aggregate £220m deployed across 115 companies

Logo with a large letter Q and the word VENTURES below it.

A long-term partner. Not just a platform

We’re building the future of property management. Join us in shaping the roadmap ahead.

Close-up of a surface with a smooth gradient from yellow to orange to red.
A dark background with a simple white leaf icon in the center.

Revenue Management

Performance Analysis

A dark background with a simple white leaf icon in the center.
A close-up view of a dark circular object with a reflective surface, showcasing a gradient from black to dark gray with some shine, possibly a piece of hardware or a decorative item.

Marketing & Leasing

A black and white abstract design.

Resident CRM & Services

A dark background with a large black curved shape in the lower right corner.

Resident Mobile App

A woman with futuristic glasses sits at a desk with two computer monitors, a keyboard, and a small device, in a modern office.

Facilities Management

Black and white abstract shape with curved and angular lines.

Finance & Accounting

A black silhouette of a peacock with its feathers fanned out.

Staff Performance Gamification

A black leaf icon on a dark background

Ready to get started?

Black circular icon with white right arrow inside.
A dark background with a simple leaf icon in the center.

What happens next…

1. Book in a Pilot Alignment Call


2. We’ll issue a Pilot Summary for review


3. Formalise agreement


4. Begin structured onboarding journey

A dark, leaf-shaped icon on a black background.
Dark background with orange and white geometric shapes, some with gradient shading.

Thanks for your time